
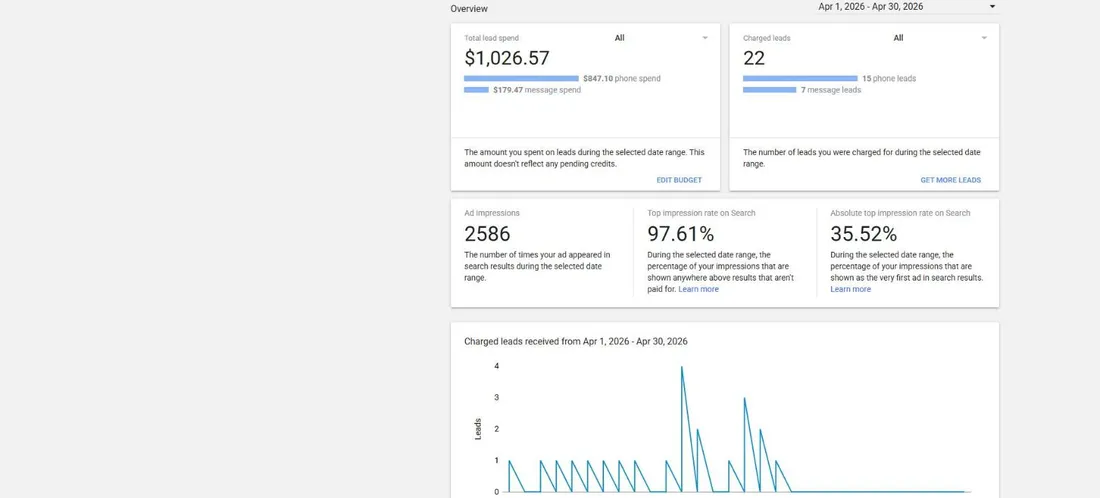
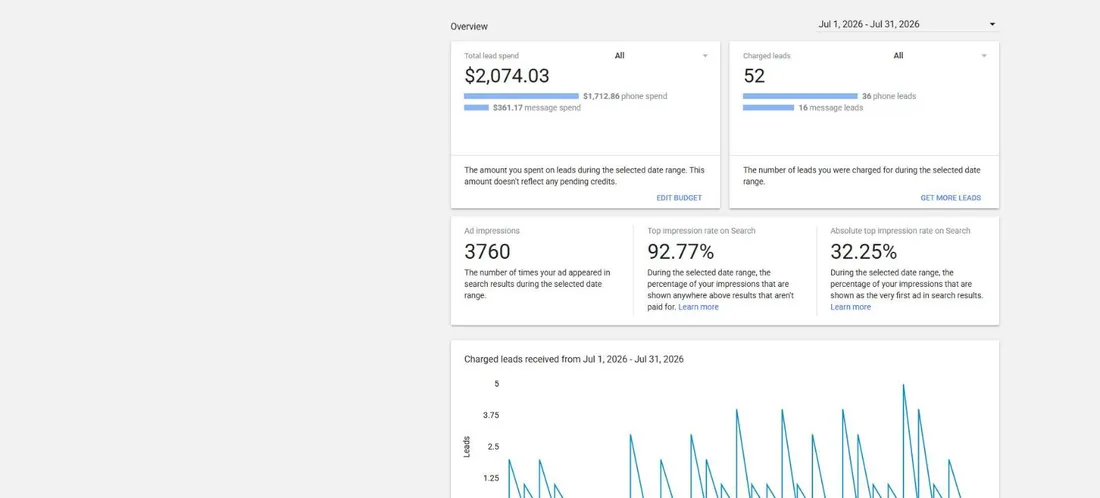
Drywall marketing case study22 charged leads in April. 52 in July.
Drywall repair · Kansas City metro · Updated July 31, 2026
Same company. Same trucks. Ninety days apart. In April my father's drywall shop had ads going dark and one tech on the road. By July the phone wouldn't stay quiet — and because he's my dad, I get to show you all of it.
Below: what April actually looked like, the exact dated changes I made in May, and every month's dashboard after — the slow ones included. No agency publishes this. Their contracts won't let them. Mine started at the dinner table.
Get this built for your trade
Fill this out and I'll run your numbers the way I ran his.
The short version
In April the ads were stalling and my father was, in his words, maybe a third booked. Ninety days later: 52 paying ad leads in July, about one website quote request a day, and the map listing ringing for free on top. Two techs on the trucks now, booked out about three weeks — his report, not a dashboard. Everything below is the dashboards: dated, screenshot by screenshot, slow months included. If a chart ever confuses you, read its caption — each one says what you're looking at in plain words.
- 52
- charged LSA leads — July 2026
- 29
- website quote requests — July 2026
- 120
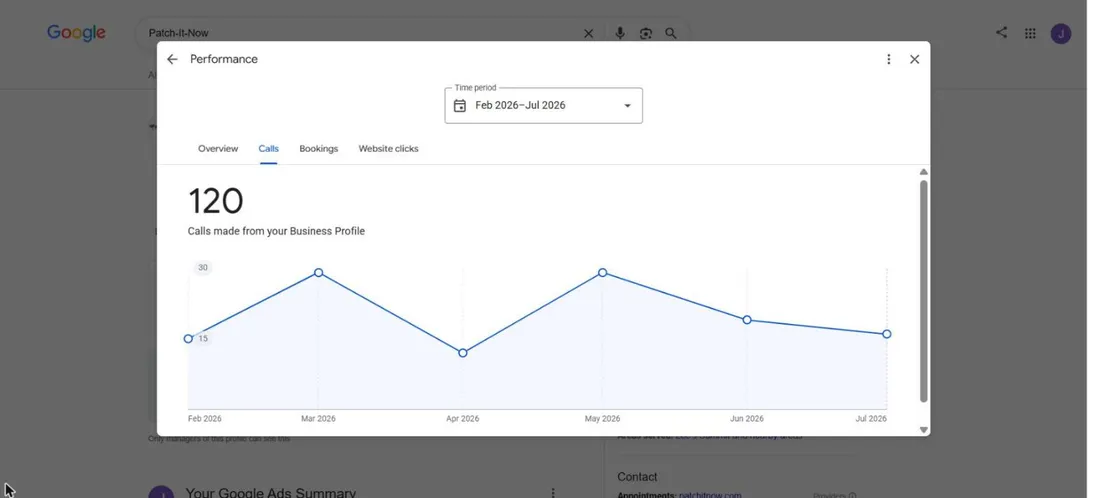
- GBP calls — Feb–Jul 2026
Where it started
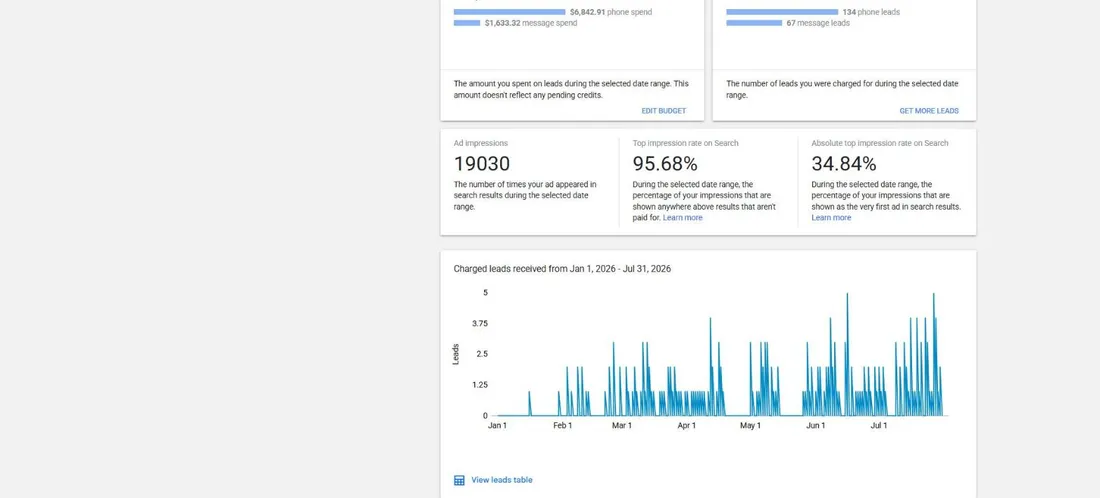
The Local Services Ads account wasn't new — it launched January 16, 2026 and produced 4 leads that first month. By spring it was stalling: decent weeks, then dead ones, and the ads went dark for the back half of April. One technician on the trucks. Dad's words, not a dashboard: "we were maybe a third booked."
I got home mid-May. What happened next has timestamps, because Google logs everything.
What I built, dated
- May 15 — I moved home and took over the marketing.
- May 16 — first Tag Manager container version in twenty-one months. The container had sat untouched since August 12, 2024.
- May 20 — second container version: tracking for the new landing pages.
- May 31 — the website quote form went live. It had never existed before; website leads were officially zero because there was nothing to submit.
- June 10–11 — the SEO rebuild deployed: new service pages, a metadata pass across the site, redirect cleanup.
Local Services Ads, month by month
These are charged leads — what Google actually billed for, after its automated credits. Spend went up because volume went up; the point is the cost per lead went downwhile it did.
| Month (2026) | Charged leads | Lead spend | Cost per charged lead |
|---|---|---|---|
| April | 22 | $1,026.57 | $46.66 |
| May | 31 | $1,286.39 | $41.50 |
| June | 44 | $1,617.81 | $36.77 |
| July | 52 | $2,074.03 | $39.89 |
The website and the Business Profile
The quote form went live May 31. June: 21 requests. July: 29 — about one a day, with the paid-search campaigns switched off entirely. The Google Business Profile added 120 calls from February through July, about 21 a month across May–July.
Search, before and after
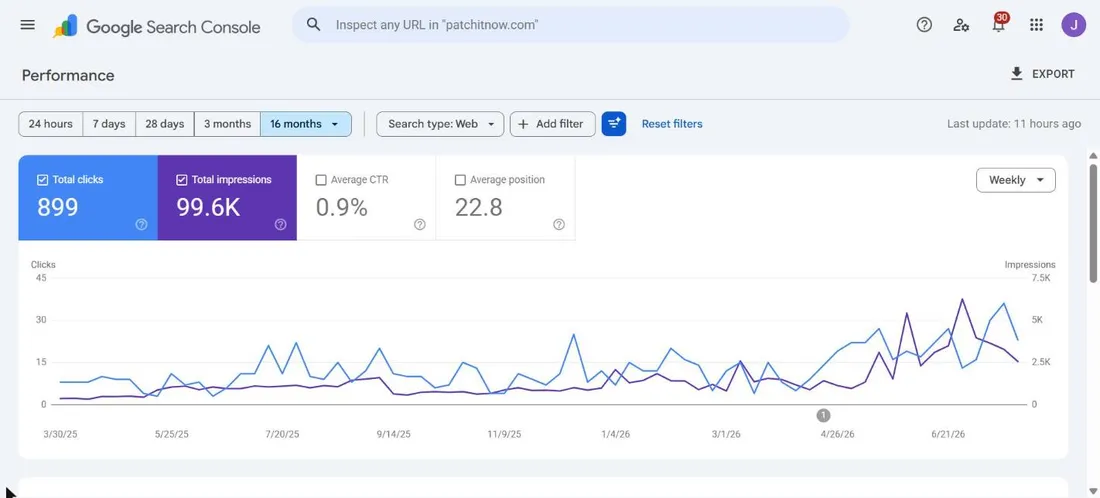
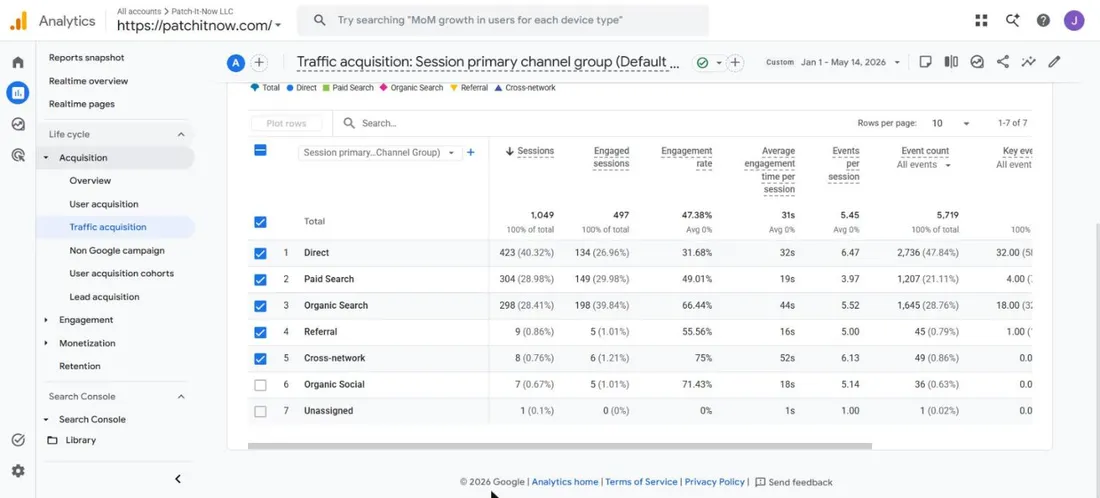
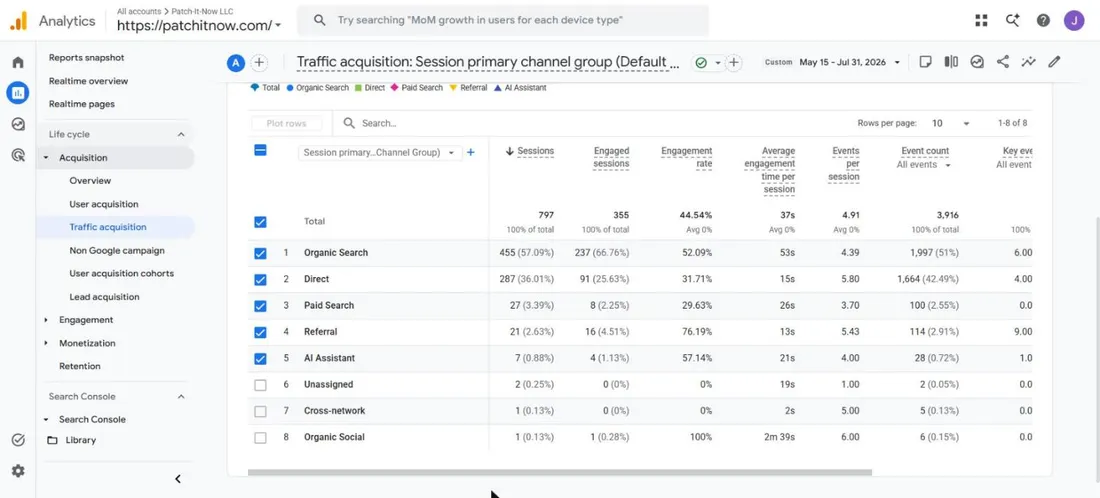
Organic clicks ran about 50 a month from January through April. May through July averaged about 94 — with the May climb starting before the June deploy, because the early trust fixes were already landing. And the part that matters for your wallet: organic sessions grew to 5.83 a day from 2.22 while paid search sessions fell from 304 to 27, because we turned the ads off.
Where it stands today
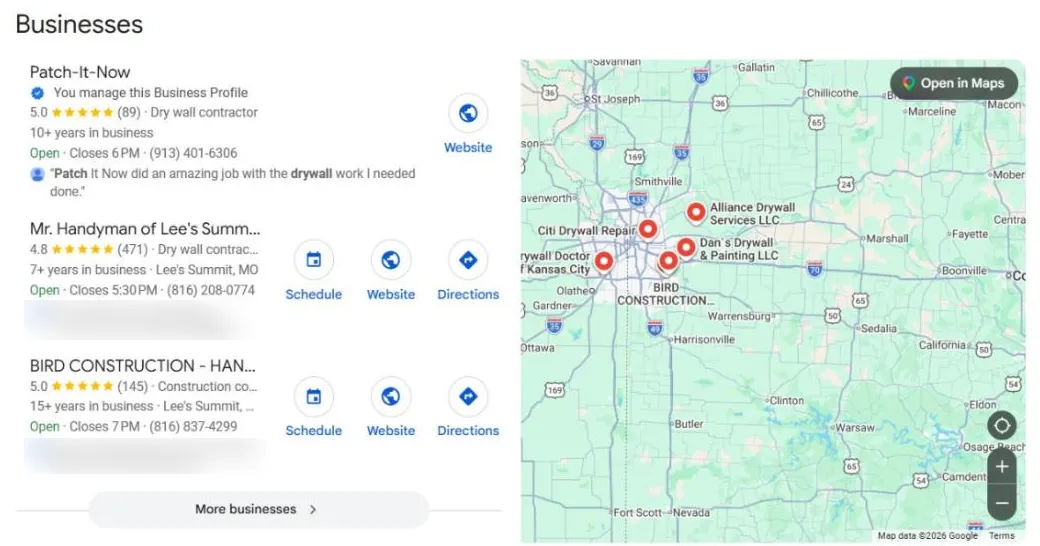
Search "drywall repair lees summit" and the map pack answers with Patch-It-Now at the top — 5.0 stars, 89 reviews — above national franchise competition. Dad's answer when I ask about the schedule, for the record: "booked out about three weeks." Two techs on the trucks now. That last part is his report, not a dashboard — the booking calendar isn't public data, and I only publish what I can screenshot.
The honest caveats
Every case study you've ever read hid something. Here's what a skeptic should know about this one:
- — The LSA account existed before me. It launched in January 2026 and produced 4 leads that month. My work was restoring and scaling a stalling channel — fixing the dead zones, the bidding, the profile — not inventing it.
- — Part of the tracked-lead jump is better tracking. The conversion event barely existed before mid-May, so I don't use analytics events as growth proof. The growth evidence is the form inbox, Google's own charged-lead billing, and Search Console clicks — systems I can't inflate.
- — May's organic climb started before the June deploy.The early-May trust and metadata fixes were already working. Rankings ramp; they don't jump on deploy day, and I won't pretend otherwise.
- — Spend rose with volume. July's budget was bigger than April's. The win is that leads grew faster than spend — the cost per charged lead fell from $46.66 to $39.89 — not "same budget, triple the leads."
- — Drywall has no Local Services Ads category. This account runs under Google's Handyman category with only the two drywall job types switched on — 2 of 14. That workaround is half the reason this case study exists.
What this looks like for your trade
The engine is the same; the math and the playbook change by trade. Pick yours:
Drywall contractors
No LSA category — there's a pathThe trade I proved this on. No LSA category exists — I run the workaround that books jobs anyway.
See the plan for drywall contractors →Painters
Repaint estimates from homeowners who already saw your five stars — not lowball bid wars.
See the plan for painters →Plumbers
Emergency calls and repipes — a schedule that fills from the searches that happen at midnight.
See the plan for plumbers →Electricians
Panel swaps and service calls from people ready to book, not tire-kickers.
See the plan for electricians →HVAC
Peak-season overflow you keep, shoulder-season leads you currently lose.
See the plan for hvac →Landscapers
Spring rush smoothed into a year of booked maintenance routes.
See the plan for landscapers →Cleaning companies
Recurring clients, not one-off deep cleans — the math changes everything.
See the plan for cleaning companies →Pest control
Quarterly contracts from one-time callers. The lifetime value is the story.
See the plan for pest control →Your dashboards could look like this.
The audit call is free, the first leads land before you pay, and slow months are refunded. You've just read the receipts; the rest is one phone call.
Get this built for your trade
Take a minute to fill out this form and I'll tell you what I'd fix.